Upgrading Strategies For Hospitals
(Golden Jubilee Hospital)
|
|
 |
|
|
|
|
Contents |
SBEM ModelDescription of the modelling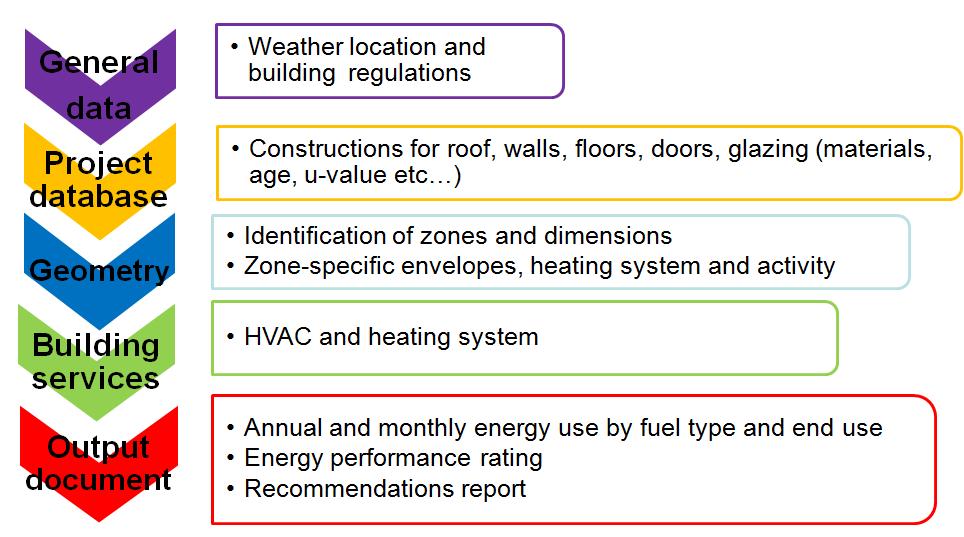 Simplified Building Energy ModelSBEM is a computer program which calculates the energy use in non-domestic buildings. It was developed by BRE for Communities and Local Government (CLG). Its purpose is to assist the procedure of Building Regulations Compliance and Building Energy Performance Certification. Building's energy consumption is analysed and monthly energy use and carbon dioxide emissions are calculated. Downloads are available here. Modelling ProcedureStep 1 - Gathering the raw data on Golden Jubilee HospitalStep 2 - Data entry:General information about the buildingWeather location: Glasgow Step 3 - Data entry:Project database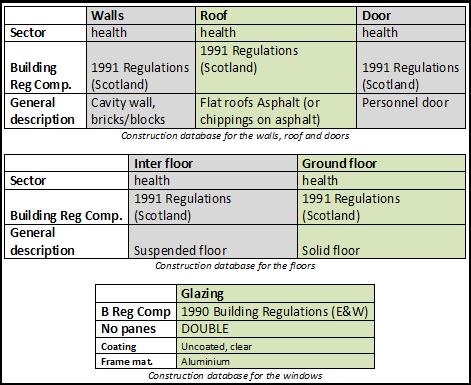 Step 4 - Zoning of the buildingThis work was realised under Autocad 2009. 148 zones were identified, zones with radiators were identified in red, whilst zones with HVAC were identified in blue. 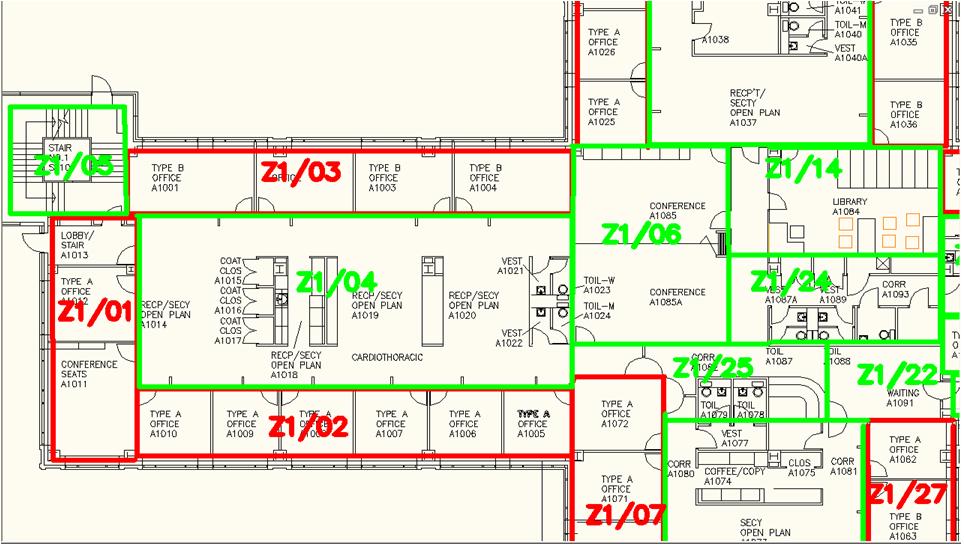 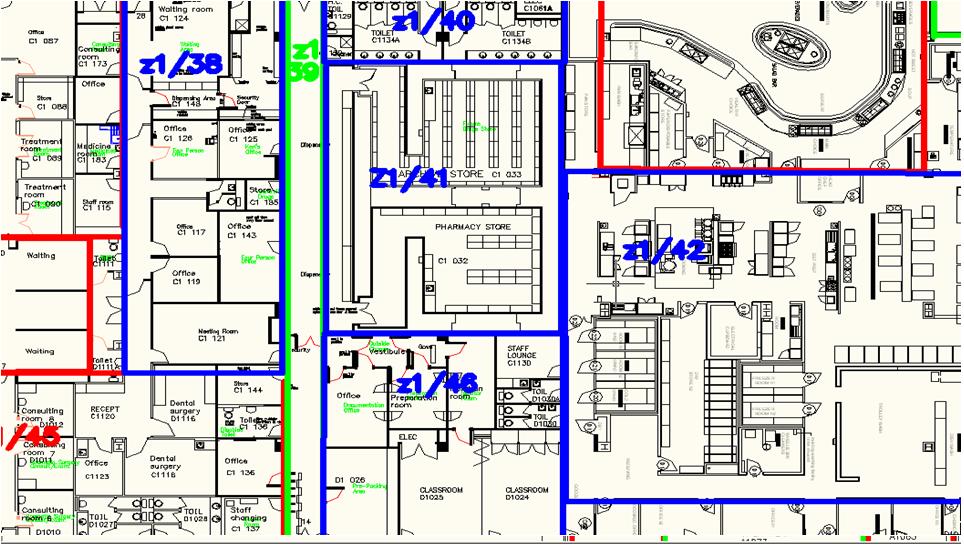 The basic dimensions of each zone have been measured and recorded in a spreadsheet along with the dimensions and the orientations of their envelopes: 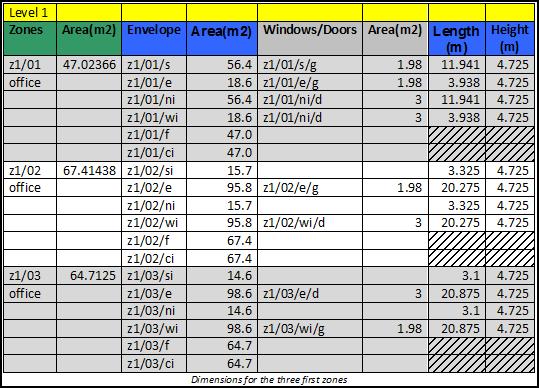 Step 5 - Data entry:GeometryThe zones have been created in the SBEM interface and their basic dimensions were entered. The envelopes of each zone were defined (walls, floor, ceiling etc). The envelopes' areas, orientations, the conditions of the adjacent spaces, and the constructions used have been defined. The areas and types of glazing or door within each envelope element were entered. Step 6 - Data entry:Building Services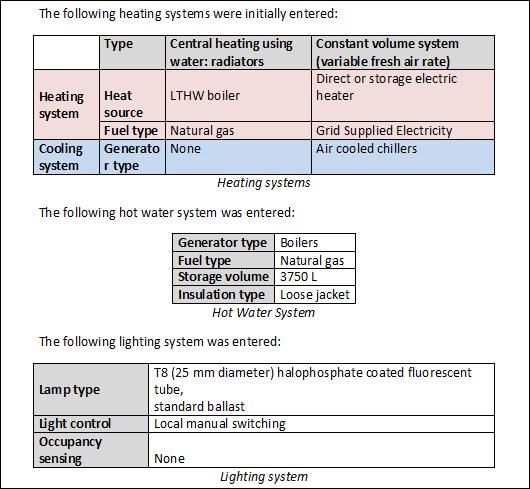 Modelling ResultsThe heated zones include the following areas 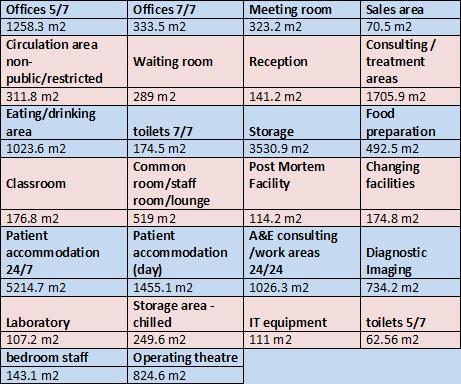 The model was run with four different scenarios for the heating system. 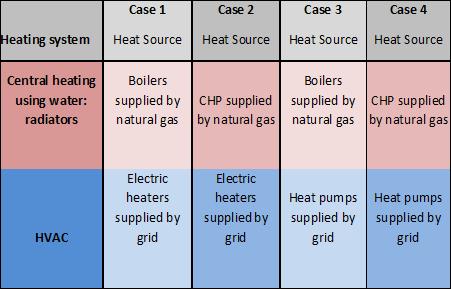 The results produced by SBEM in the four consecutive simulations are contained in the following table. 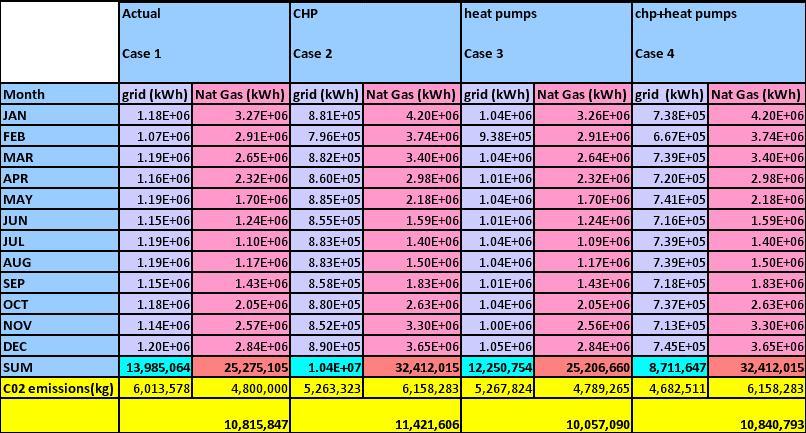 The annual energy consumption has been represented graphically below. 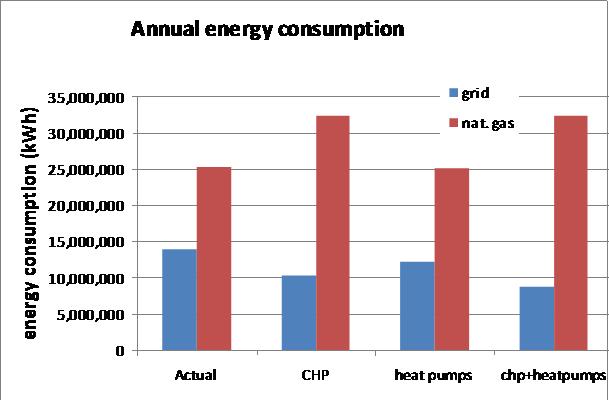 The monthly energy consumption has been represented graphically below. 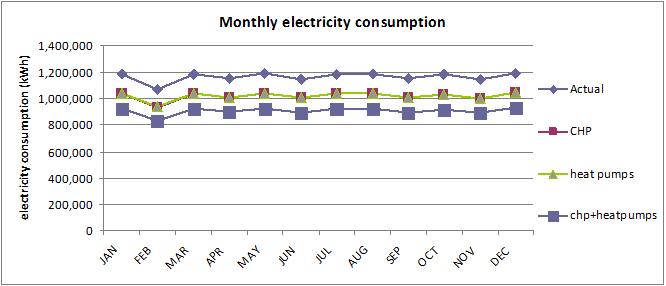 The monthly gas consumption has been represented graphically below. 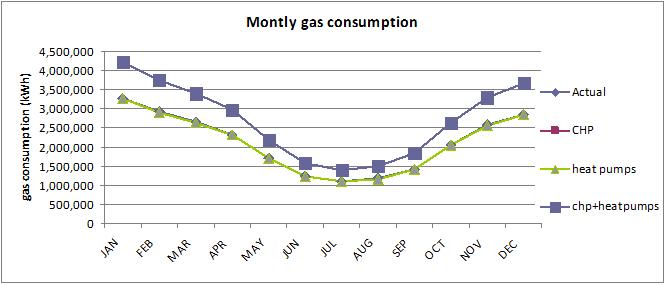 The annual CO2 emissions have been represented graphically below. 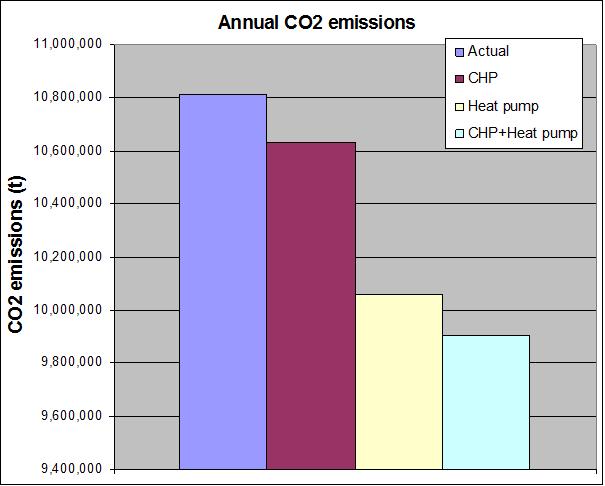 |
Renewable Energy Systems & The EnvironmentGroup ProjectIt is the hope of the Energy Systems and Environment project team that the information contained in this website will contribute to the relevant field. Please feel free to use any of the findings presented to further your own study, making due acknowledgement where appropriate. |
|